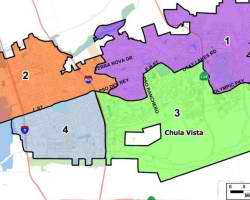
The Chula Vista Districting Commission’s recommended map shows that the 2016 elections in Chula Vista will seat council members representing southwest and southeast Chula Vista, pending approval from the City Council on July 14.
As part of Prop. B, which voters passed in 2012, the mayor and city attorney will be elected citywide with city council members elected by districts.
The commission met twice last week to construct its final recommended map and to number the four council districts.
District 1, the purple colored district, makes up northeast Chula Vista and starts from Terra Nova shopping center, going east past Telegraph Canyon Road. The total population for this district is 62,401 with 47.46 percent of the people being Latino, 25.05 percent white, 20.94 percent Asian and 4.67 percent black
Northwest Chula Vista, the orange district, is District 2 and encompasses central Chula Vista, downtown and extends out L Street to Paseo del Rey, then curls up to H Street and comes back west toward Interstate 805. District 2 has a population of 60,166, mainly consisting of Latino at 63.58 percent, white at 23.87 percent, followed by Asian at 6.59 percent and black at 4.11 percent.
The green colored district, District 3, has a population of 60,384 and covers parts of Interstate 805 along Telegraph Canyon Road, with the boundaries coming up Paseo del Rancho to H Street. Then the boundaries come back to La Media, back to Telegraph Canyon Road and back down to Hunte Parkway. Latinos are the majority with 46.47 percent of the population, followed by Asians at 27.29 percent, whites at 18.29 percent and blacks with 5.66 percent.
This district also includes the Southwestern College area and neighborhoods south of Olympic Parkway.
District 4, the blue colored district, keeps all of southwest Chula Vista intact. The district lines stretch from I-805 to the bay and include the Montgomery area.
L Street divides the southwest and northwest districts.
Total population for District 4 is 60,966 with 75.68 percent of that population being Latino, 14.11 percent white, 5.18 percent Asian and 3.33 percent black.
Tino Martinez, president of Southwest Chula Vista Civic Association, said southwest residents are happy to get a council member in their area.
“By districting our city, it allows us to hold our resident representatives accountable,” he said. “Hopefully now our community’s needs will be met and our uniqueness preserved.”
Jerome Torres, Districting Commission chairman, said the recommended map was fair to community organizations.
“I think the map represents a compromise by the Unity Coalition and the Filipino-Asian community that supported the APACE corridor because it allowed the merging of both,” he said.
The Unity Coalition is a community group that includes labor and other groups.
The Asian Pacific American Cultural Economic Corridor encompasses the business corridor of API-owned businesses and the schools where the API community attends in Chula Vista.
In numbering the districts, the commission used the informed randomness process in assigning each number to a district.
Torres said the process used addressed the “overwhelming public testimony” of residents in southwest Chula Vista and the Filipino Asian community who reside in District 3 in wanting to have their districts come up for election in 2016.
In having some randomness in the numbering process, the commission took the two south districts and put them in the 2016 election cycle, then randomly assigned Districts 3 and 4.
Then they decided which districts got assigned districts 1 and 2.


